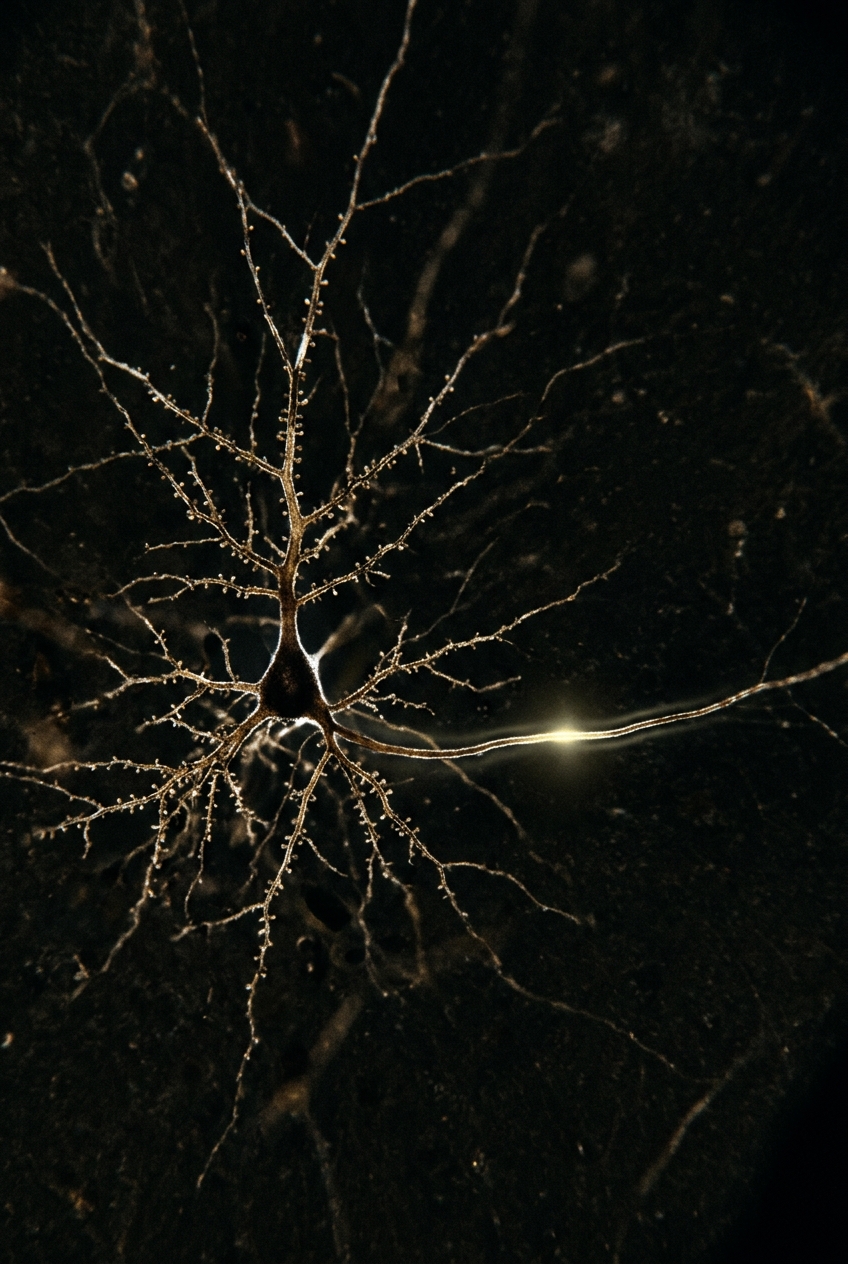
Inspired by Biological neuron spike trains
Spike-Timed Event Log
Counterpart to Payload-heavy event logs
An event log where the temporal pattern is the payload: compact spike events, classified into firing patterns during ingest.
benchmarked
01
Key properties
- 01O(1) amortized ingest with 17–81 byte events (26–48× compression vs JSON logs)
- 02Real-time pattern classification via streaming ISI analysis (Tonic, Burst, Accelerating, Decaying, Silent, Irregular)
- 03Pre-computed rate counters with O(1) dashboard queries
- 04Population-aware correlation: synchrony detection, burst analysis, N-of-M integration
- 05Segmented append-only storage with sparse stream indexing
- 06Refractory period enforcement prevents ingestion flooding
02
Operation complexity
Side-by-side with the classical counterpart.
| Operation | Spike-Timed Event Log | Payload-heavy event logs |
|---|---|---|
| ingest | O(1) amortized | O(1) amortized |
| rate query | O(1) | O(n) or pre-aggregated |
| pattern classification | O(1) streaming | N/A |
| population correlation | O(streams) | N/A |
| space per event | 17-81 bytes | 200-2000 bytes |
03
Interface preview
pub struct SpikeStore { /* ... */ }

impl SpikeStore {
    pub fn new(config: SpikeStoreConfig) -> Self;
    pub fn from_preset(preset: SpikePreset) -> Self;

    pub fn register_tags(&mut self, tags: &[(String, String)]) -> u64;
    pub fn ingest_presence(&mut self, tag_hash: u64, timestamp_ns: u64)
        -> Result<(), SpikeError>;

    pub fn stats(&self) -> &StoreStats;
}
04
Where this matters
Datadog / Splunk · Log Ingestion Pipeline
| Today | With Spike-Timed Event Log | How |
|---|---|---|
| 200–2000 byte structured log entries | 17–81 byte spike events | Presence-class encoding; temporal pattern is the payload |
| Post-hoc pattern analysis (regex, ML) | Real-time 6-class pattern classification | Streaming ISI analysis classifies patterns during ingest |
| Rate dashboards require pre-aggregation pipelines | O(1) rate queries from pre-computed windows | Sliding rate counters maintained inline during ingest |
05
Interactive simulation
svc-aSilent
svc-bSilent
svc-cSilent
svc-dSilent
svc-eSilent
svc-fSilent
Raster of the last 100 ticks. Labels come from streaming inter-spike-interval analysis; green when they match the stream's true pattern.
Field notes
- Silence on every stream…
- Events
- 0
- Spike log
- 0 B
- JSON (≥200 B ea.)
- 0 B
- Dropped (refractory)
- 0
- Synchrony
- 0
- Classified right
- 1 / 6
Tick 0 / 300Teaching model · 17 B per spike event · JSON estimate uses the 200 B lower bound
Figure. Spike-Timed Event Log at tick 0 of 300. Teaching model · 17 B per spike event · JSON estimate uses the 200 B lower bound.
Illustrative simulation, not a benchmark · Mutuus Research, ByteQuilt
Discussion